A number says nothing

until it has company.

The Nyckeltalsinstitutet database is now part of Heartpace. People analytics with a yardstick – measure yourselves against your industry, not against a hunch.

Powered by Nyckeltalsinstitutet · 800,000 employees in the database

Trusted by 1,000+ companies using Heartpace HR.

Problem

Gathering HR data in one place does not help if you cannot tell what the numbers mean.

That is the Data Vacuum in practice. Is 4% turnover good, or an early warning? With nothing to measure against, you stay in the Reactive Trap: firefighting where there should be strategy.

Solution

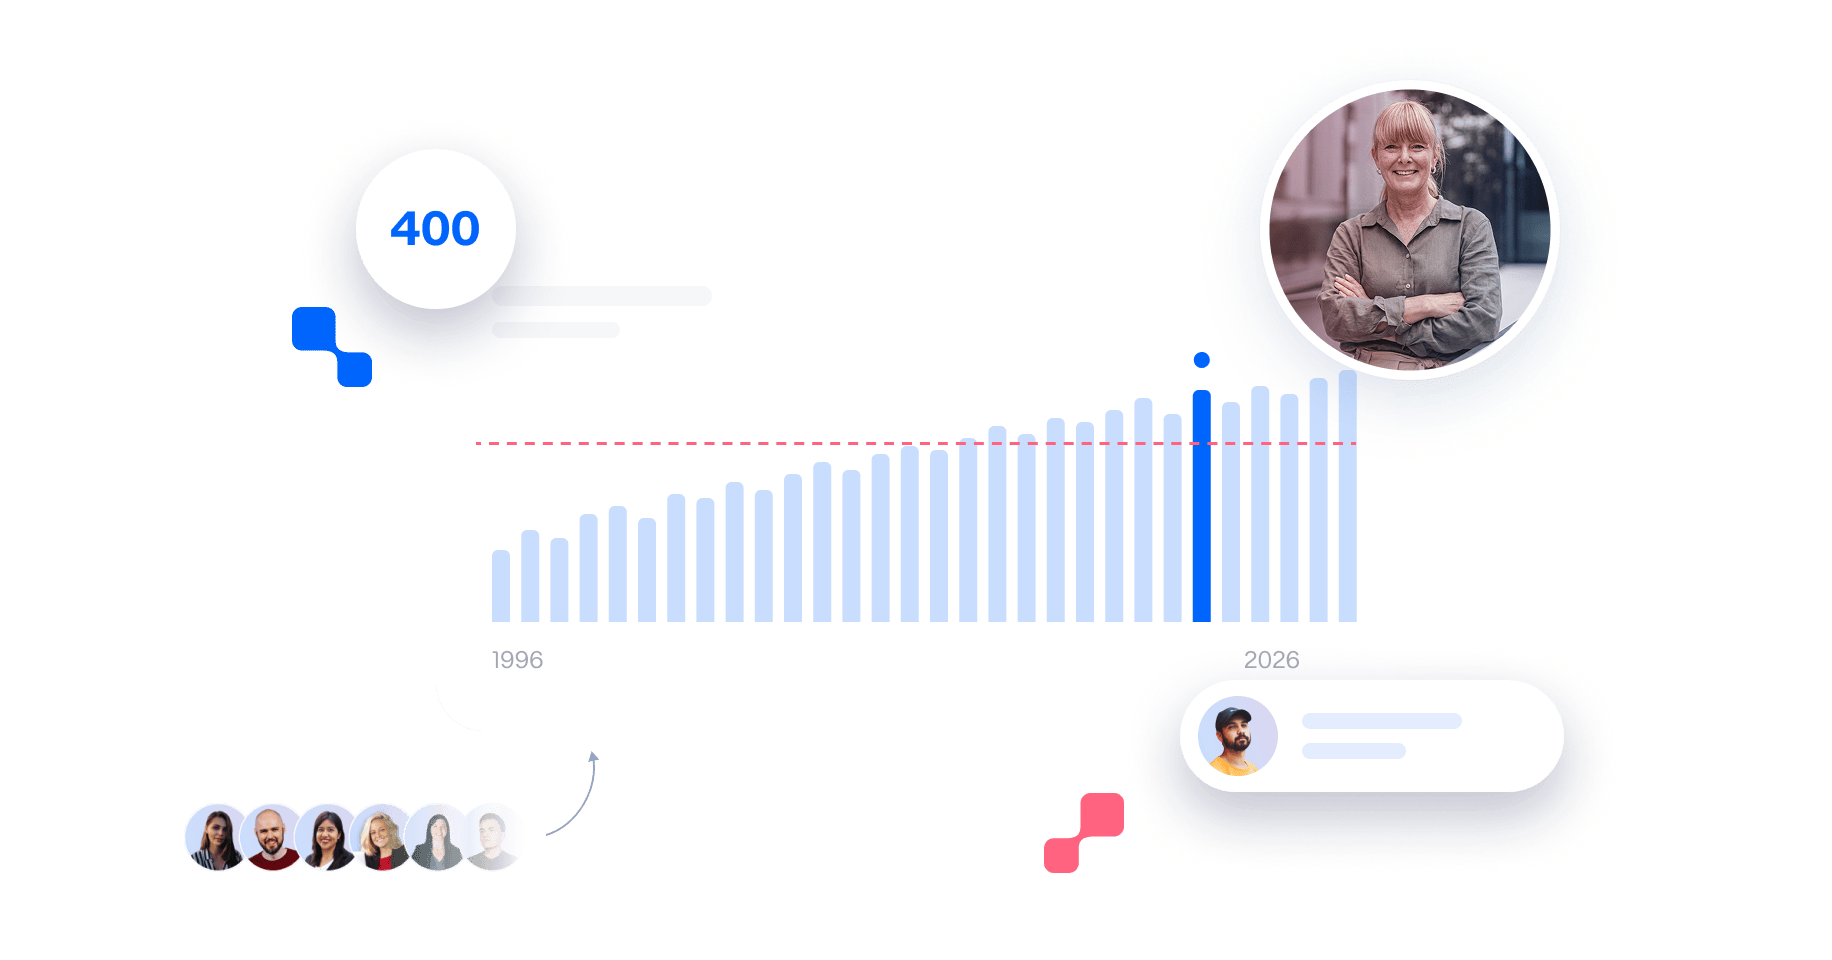
We connect your data to 30 years of Swedish labour market statistics from Nyckeltalsinstitutet – 800,000 employees at roughly 400 organisations, collected on the same definitions since 1996.

You get the answer to what the numbers mean, and an expert who helps you read them.

Board-ready figures

Walk into every board meeting with numbers your leadership trusts.

Early warning signs

Catch risks in working conditions and health before they hit the bottom line.

Budget with impact

Put your HR budget where it changes something.

How it works

1. Connect

Your workforce data is securely connected to Heartpace.

2. Compare

We set your figures against Nyckeltalsinstitutet's 30-year database.

3. Act

You get clear recommendations – not just another report.

“The external comparison gives us an important reality check. Seeing in black and white how we compare to others gives us clear, fact-based grounds for prioritising the right initiatives and putting our resources to best use.”

Viktor Larsson

HR Analyst, Migrationsverket (the Swedish Migration Agency)

See how Uddevallahem produces reports and analyses on, for example, age distribution, employee turnover, and length of service.

Read customer case

FAQ

What is the difference between an HR dashboard and HR analytics?

A dashboard shows your own numbers. HR analytics is about understanding them, and that takes something to compare against. You can have the best-looking dashboard on the market and still not know whether 4% turnover is good or bad.

How long does it take to see the benchmark data?

You get access to the benchmark as soon as your data is mapped. Your own figures join the comparison through the annual reporting round, which is what keeps every organisation’s numbers on the same definitions.

How do our figures get into the comparison?

You report them on Nyckeltalsinstitutet’s definitions, exactly as every participating organisation does. That is what makes the figures comparable in the first place.

Which labour market does the benchmark cover?

Sweden. The database has been built on Swedish organisations since 1996, so the comparison is against the Swedish labour market – which is what makes it precise enough to act on.

Do we get help analysing the numbers?

Yes. Your contact at Heartpace is always available.

Ready to see where you actually stand?