Find the gaps

no survey can show you.

Mapping in partnership with Statistics Sweden since 2011. 500+ completed mappings, 330,000 employees in the comparison database.

In partnership with Statistics Sweden (SCB) · Aggregated and de-identified statistics · Part of Heartpace

Trusted by 1,000+ companies using Heartpace HR.

Problem

Diversity work without facts never gets past good intentions – hard to prioritise, impossible to prove.

You do not know where your actual gaps are.

Solution

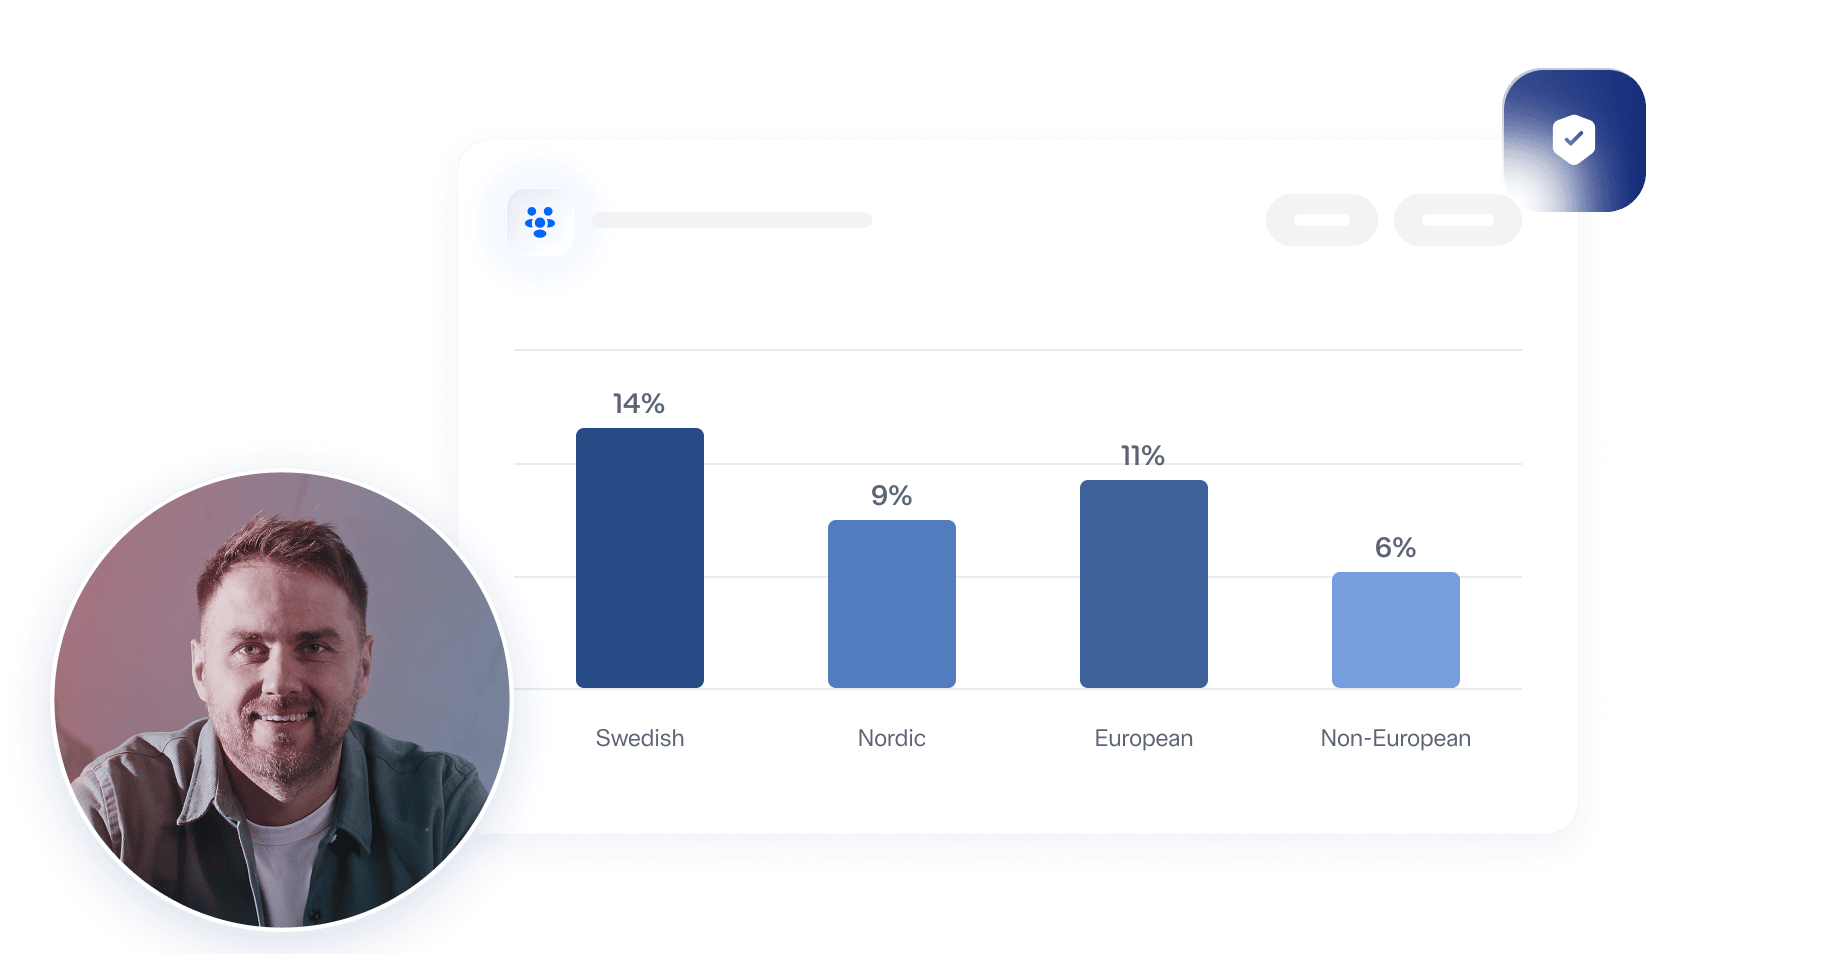
Diversity mapping gives you diversity metrics across workforce structure, employment terms, management representation, salaries, education levels, and mobility – broken down by background using SCB's definitions (Swedish, Nordic, European, non-European background).

All matching is done by SCB, and the result is delivered aggregated and de-identified.

Facts instead of assumptions about where your gaps are.

Comparable against 330,000 employees in the database.

Evidence that links to Agenda 2030, goals 5, 8, and 10.

How it works

1. Submission

You send your data directly to Statistics Sweden. Heartpace is not involved in that step.

2. Matching

SCB matches the data against its own statistics and performs a disclosure review before the result is produced.

3. Aggregation

Groups under ten people are never reported. Instead the result is regrouped to a higher level — two background categories instead of four, for example — so you still get a usable answer.

4. Report

Heartpace receives finished statistics, de-identified and aggregated. You get a visual report with industry comparisons and, where the data supports it, a regional breakdown.

“By analysing our diversity data, we get fact-based insights that help us understand our structures and make better decisions. That gives us a stronger foundation for building an inclusive workplace where more people can develop and contribute their full potential.”

Victor Pettersson

Head of Employee Experience, People & Organisation, Systembolaget

FAQ

Which diversity metrics do you actually get?

Workforce structure, employment terms, management representation, salaries, education levels, and mobility — each broken down by background and set against an industry comparison. They are built from register data matched by Statistics Sweden, which is what separates them from anything a survey can produce.

How is individual employee privacy protected?

You submit the data to Statistics Sweden, which matches it against its registers and performs a disclosure review before any statistics are produced. Heartpace receives finished statistics – de-identified and aggregated. We never see personal data.

What happens if a group is too small?

Groups under ten people are never reported separately. The result is regrouped to a higher level instead, so you get a picture without anyone being identifiable.

Which background categories are used?

SCB’s standard definitions: Swedish, Nordic, European, and non-European background, with a possible regional breakdown.

Can we use this in sustainability reporting?

As evidence, yes. The mapping links to Agenda 2030 goals 5, 8, and 10, and it delivers the kind of workforce structure data ESRS S1 asks for. Expect the figures to need adapting to the reporting standard’s own definitions.

Does this work outside Sweden?

The mapping is built on Statistics Sweden’s registers, so it covers your Swedish operations. For an international group that makes it a precise picture of one market rather than an approximation of several.

Explore our Indices

Compare your organisation with the industry, and turn your HR data into results you can show.

Ready to measure your diversity for real?