Every HR system shows your turnover.

Only one can tell you whether it is good.

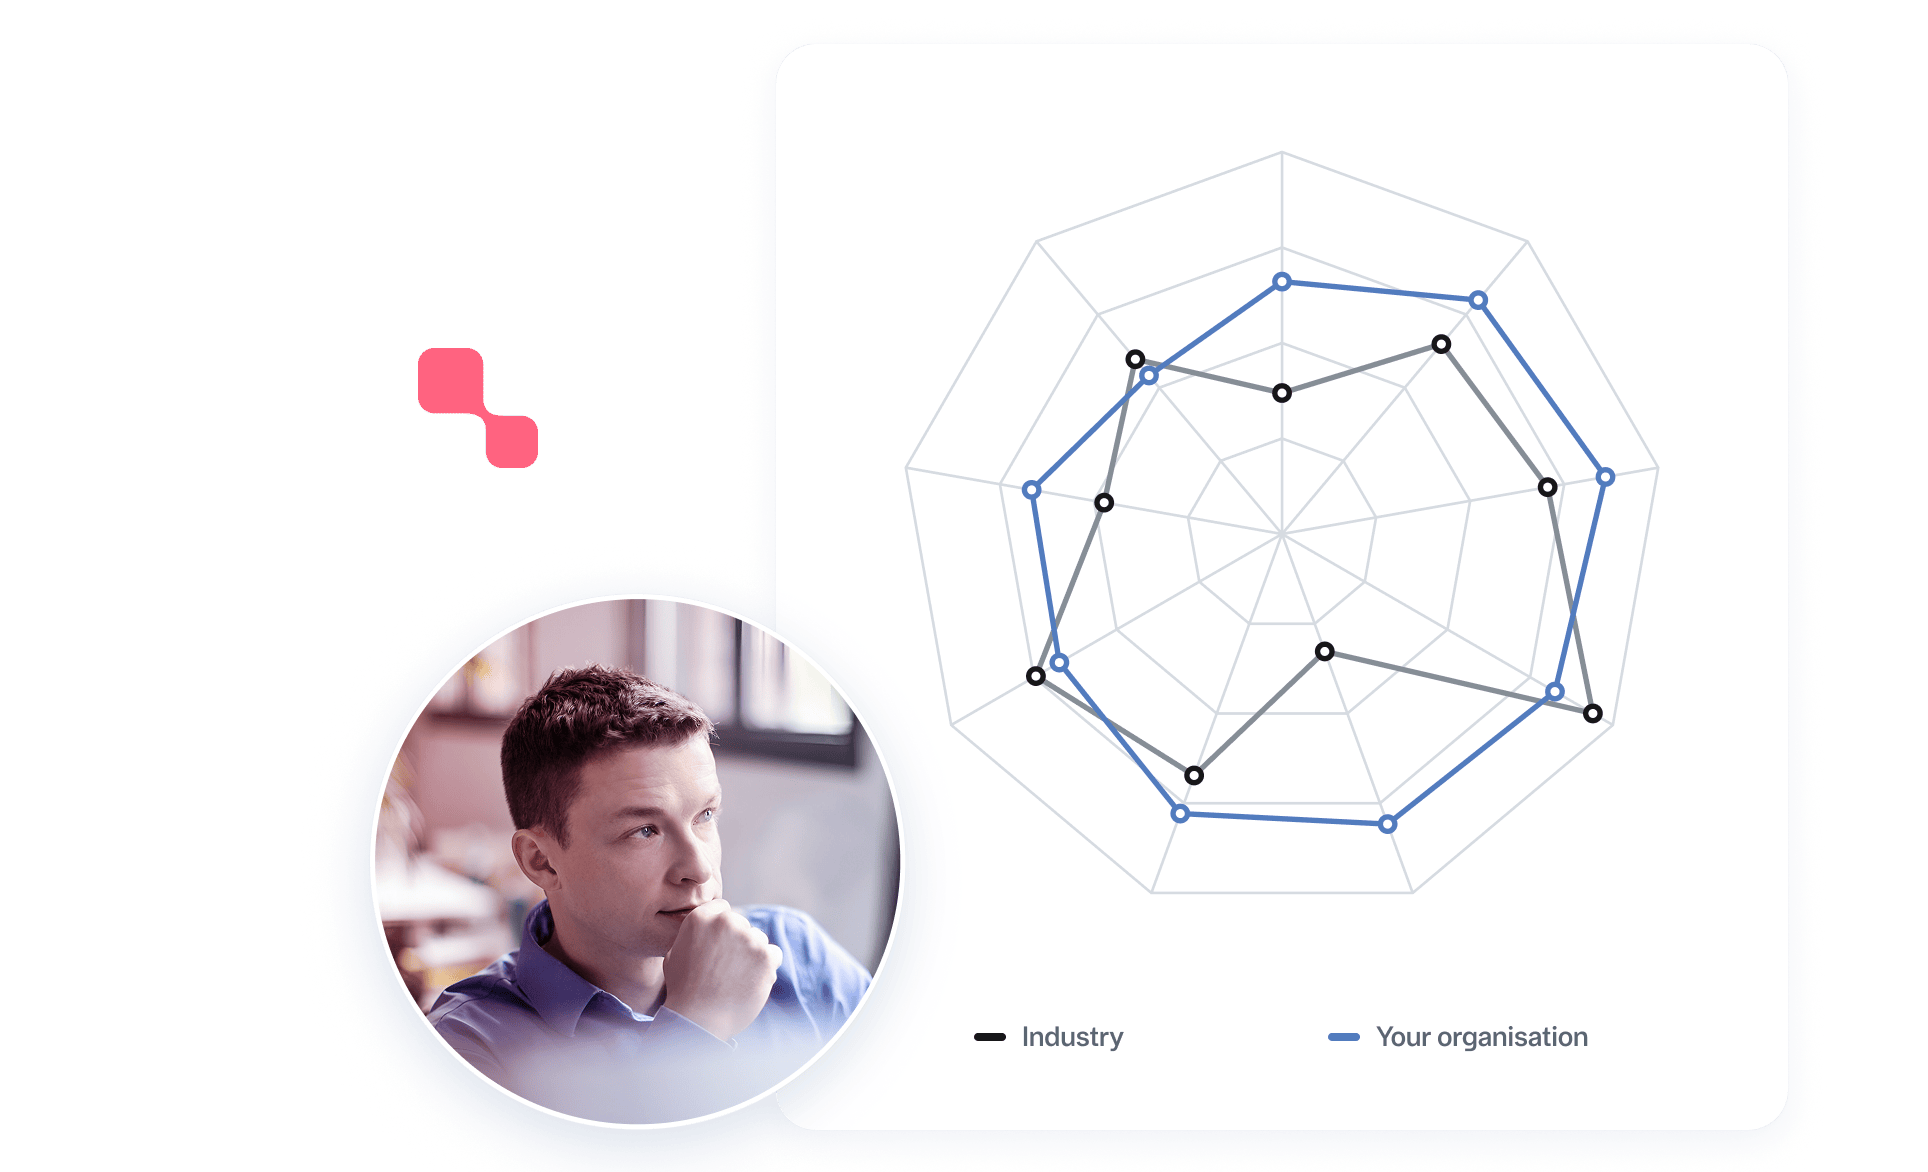
You already have the numbers. Sick leave, turnover, pay spread, span of control. What is missing is the answer to the only question a number actually raises: is this good or bad?

800,000 employees · 400+ organisations · The same definitions since 1996

Your sick leave is at 6.2 per cent.

Is that good?

The question cannot be answered from the inside. You can compare against last year and see a direction, but not against anything that tells you whether the level is reasonable for your industry. An HR system that gathers all the data in one place solves the collection — it still says nothing about what the figures mean.

That is the Data Vacuum: data without context is just loose numbers.

Why this comparison is a different thing

There are other systems with benchmarking features. The difference is in what they compare against.

The data is collected independently.

The 400+ organisations report to an institute, not to a software vendor — whatever HR system they run themselves. So you are compared against the Swedish labour market, not against others who happen to have bought the same software as you.

These are hard figures, not perceptions.

Quantitative HR data only — no survey responses and no estimates. Who left, who was off sick, what was paid, how many people a manager is responsible for. Surveys measure what employees think; this measures what happened.

The definitions have been fixed since 1996.

That is what makes a comparison across years and between companies mean something. A time series cannot be built retrospectively — no budget changes that.

The result can be used externally.

An internal percentile in a dashboard is a number nobody outside the company recognises. Nyckeltalsinstitutet’s measures drive national awards and are cited by public authorities and industry bodies.

How the comparison works

1. Reporting

You report your key figures on Nyckeltalsinstitutet's definitions — the same definitions every participating organisation uses.

2. Mapping

The measures are mapped to Nyckeltalsinstitutet's standardised measures and definitions. All data is anonymised and aggregated.

3. Comparison group

You are compared against your industry, from about 25 industries across the private and public sectors.

4. Result

You see where you stand, against whom, and how it has moved over time.

What you can compare

  • Employee turnover
  • Sick leave, short and long
  • Pay levels and pay spread
  • Span of control and management responsibility
  • Forms of employment
  • Skills development
  • Overtime

And where a whole area needs weighing into a single figure, there are our three indices — the Attractive Employer Index (AVI®), the Gender Equality Index (JÄMIX®), and Health Index™ — each built on nine key figures with the same methodology.

FAQ

How are our figures protected?

All data is anonymised and aggregated, and all measures and definitions are standardised. No individual organisation can be read out of the material.

Which industries are covered?

About 25 industries across the private and public sectors in Sweden, with data spanning thirty years.

Can we choose who we are compared against?

Yes, by industry. You choose from about 25 industries. Filters for size and region are not available today.

Is the benchmark only Swedish?

Yes, and that is deliberate. Labour law, collective agreements, parental leave, and sick pay differ so much between countries that a pan-European average would compare things that are not comparable. Against the Swedish labour market, the figure is precise enough to act on.

We already get an annual report. What does the platform add?

The report tells you where you stood last year. In the platform the comparison sits next to the figure while it moves, so a pattern shows while there is still something to be done about it.

Find out what your numbers mean.